Twitch earnings and the Zipfian distribution
Recently there was the Twitch leaks that someone packaged the earnings subset of into a neat space-separated file. Since it’s so easily read by machine I decided to do some simple graphs with it.
Twitch streamers earnings against rank, with Zipf and ordinary exponential fits.
🖼️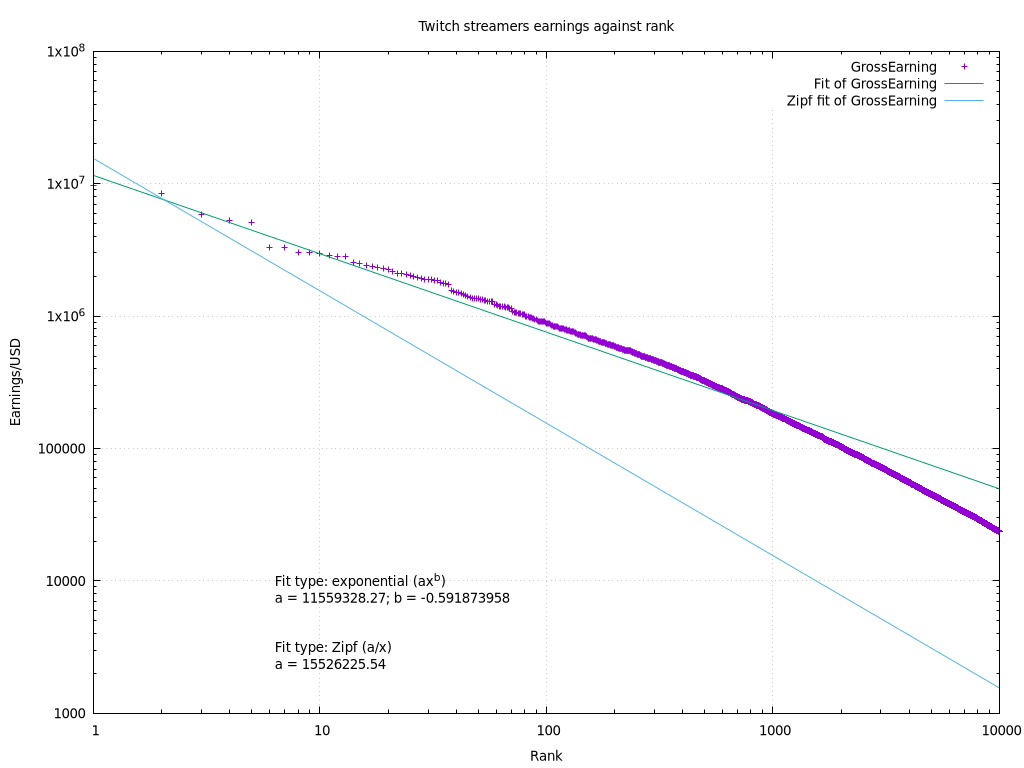
One of the things I noticed is that it’s not really Zipfian. It is exponential but the tail is very much flatter than what a Zipfian distribution would expect. However, even the exponential fit isn’t perfect. There’s that characteristic bulge where the exponent turns over significantly at about the 400th rank. I saw it happen with some other distributions too, like the word frequency chart in Wikipedia, so I am thinking if I can make a new empirical distribution out of it.
I also only have the top 10 000 accounts, so I don’t know what would happen if I include all of it. If someone has a more complete list, here’s the source code that I used to generate the chart above, assuming that you have it in a directory where it is called earnings.csv.
#!/usr/bin/gnuplot
set terminal pngcairo font ",10" size 1024, 768
set output "twitch-earnings-gen.png"
set title "Twitch streamers earnings against rank"
set logscale xy
set grid
set key autotitle columnhead
set ylabel "Earnings/USD"
set xlabel "Rank"

expfit(x) = a * x ** b
a = 3000000
b = -1
fit expfit(x) 'earnings.csv' using 1:4 via a, b

zipf(x) = zipf_a * x ** -1
zipf_a = 3000000
fit zipf(x) 'earnings.csv' using 1:4 via zipf_a

set label sprintf("Fit type: exponential (ax^b) \na = %8.2f; b = %1.9f", a, b) \
    at graph 0.2, graph 0.2
set label sprintf("Fit type: Zipf (a/x) \na = %8.2f", zipf_a) \
    at graph 0.2, graph 0.1
plot 'earnings.csv' using 1:4, \
     expfit(x) title "Fit of GrossEarning", \
     zipf(x) title "Zipf fit of GrossEarning"
Disclaimer – I will not publish any raw data that I have.